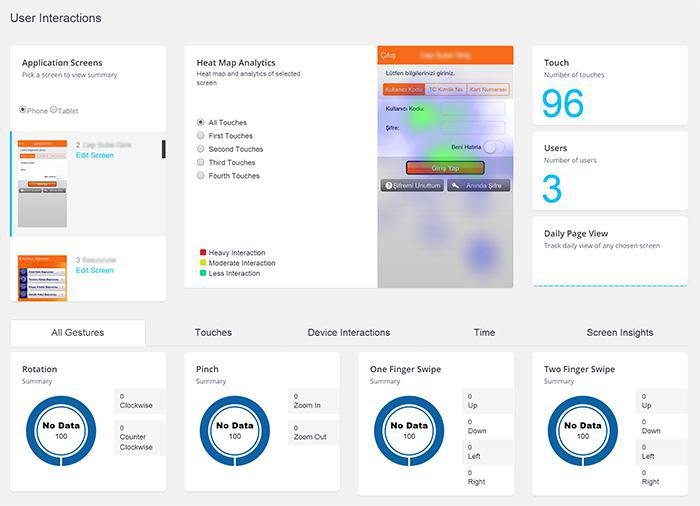
Dasudian Analytics records all operation events of your users and devices and shows as a heat map. Dasudian Analytics allows you to see all specific actions (shutdown, touch, twist, pinch, press, etc.) as a heat map analytics.
Machine Maintaners, Production Managers and App Developers can get answers of these questions with operation heat maps:
Sign up now to get your free heat map analytics now!
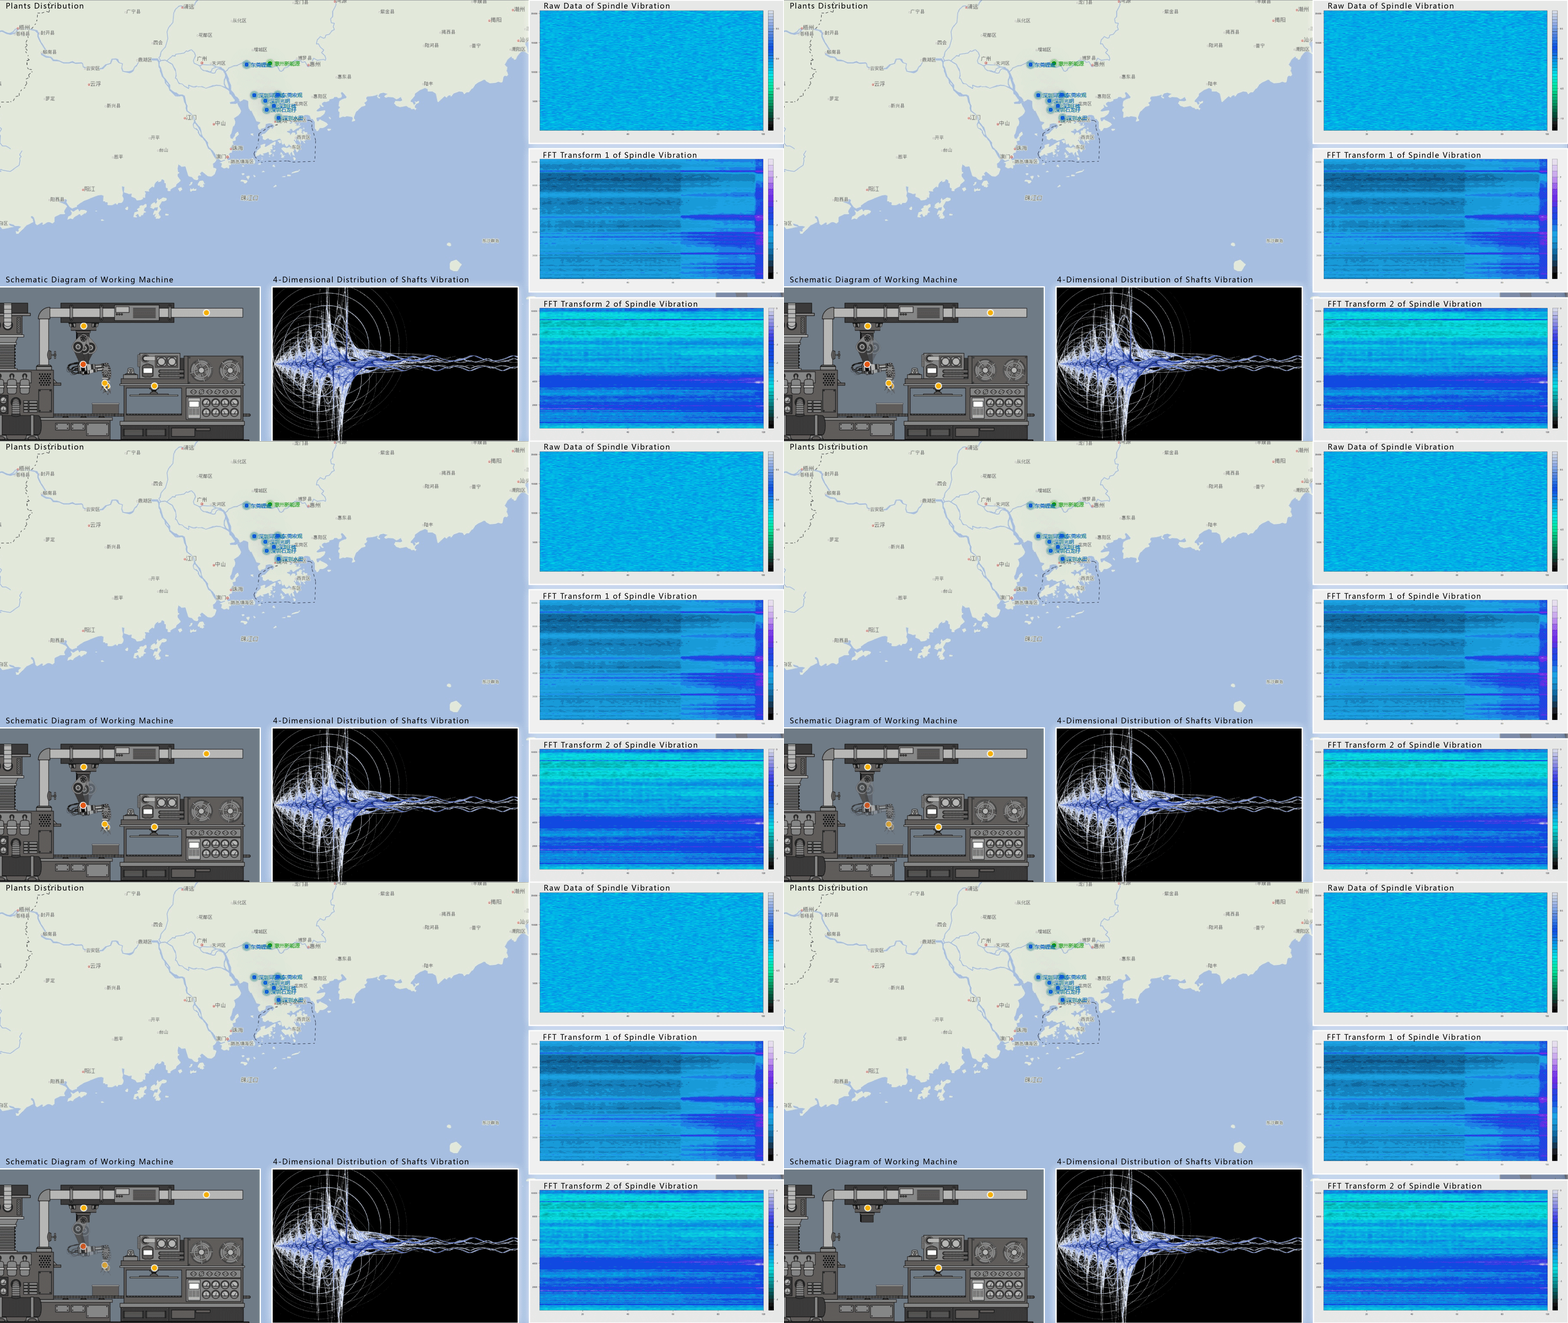
Dasudian Analytics allows engineers and production managers to track status of your assets and IT systems. Engineers can track all movement and failure patterns for predictive maintenance.
Also, Dasudian Analytics allows engineers to track device interactions like power on, shutdown, shake, pinch, device orientation, and location.
Engineers and managers can get answers of these questions with pattern recognition and health prediction:
Sign up now to see your patterns for free!
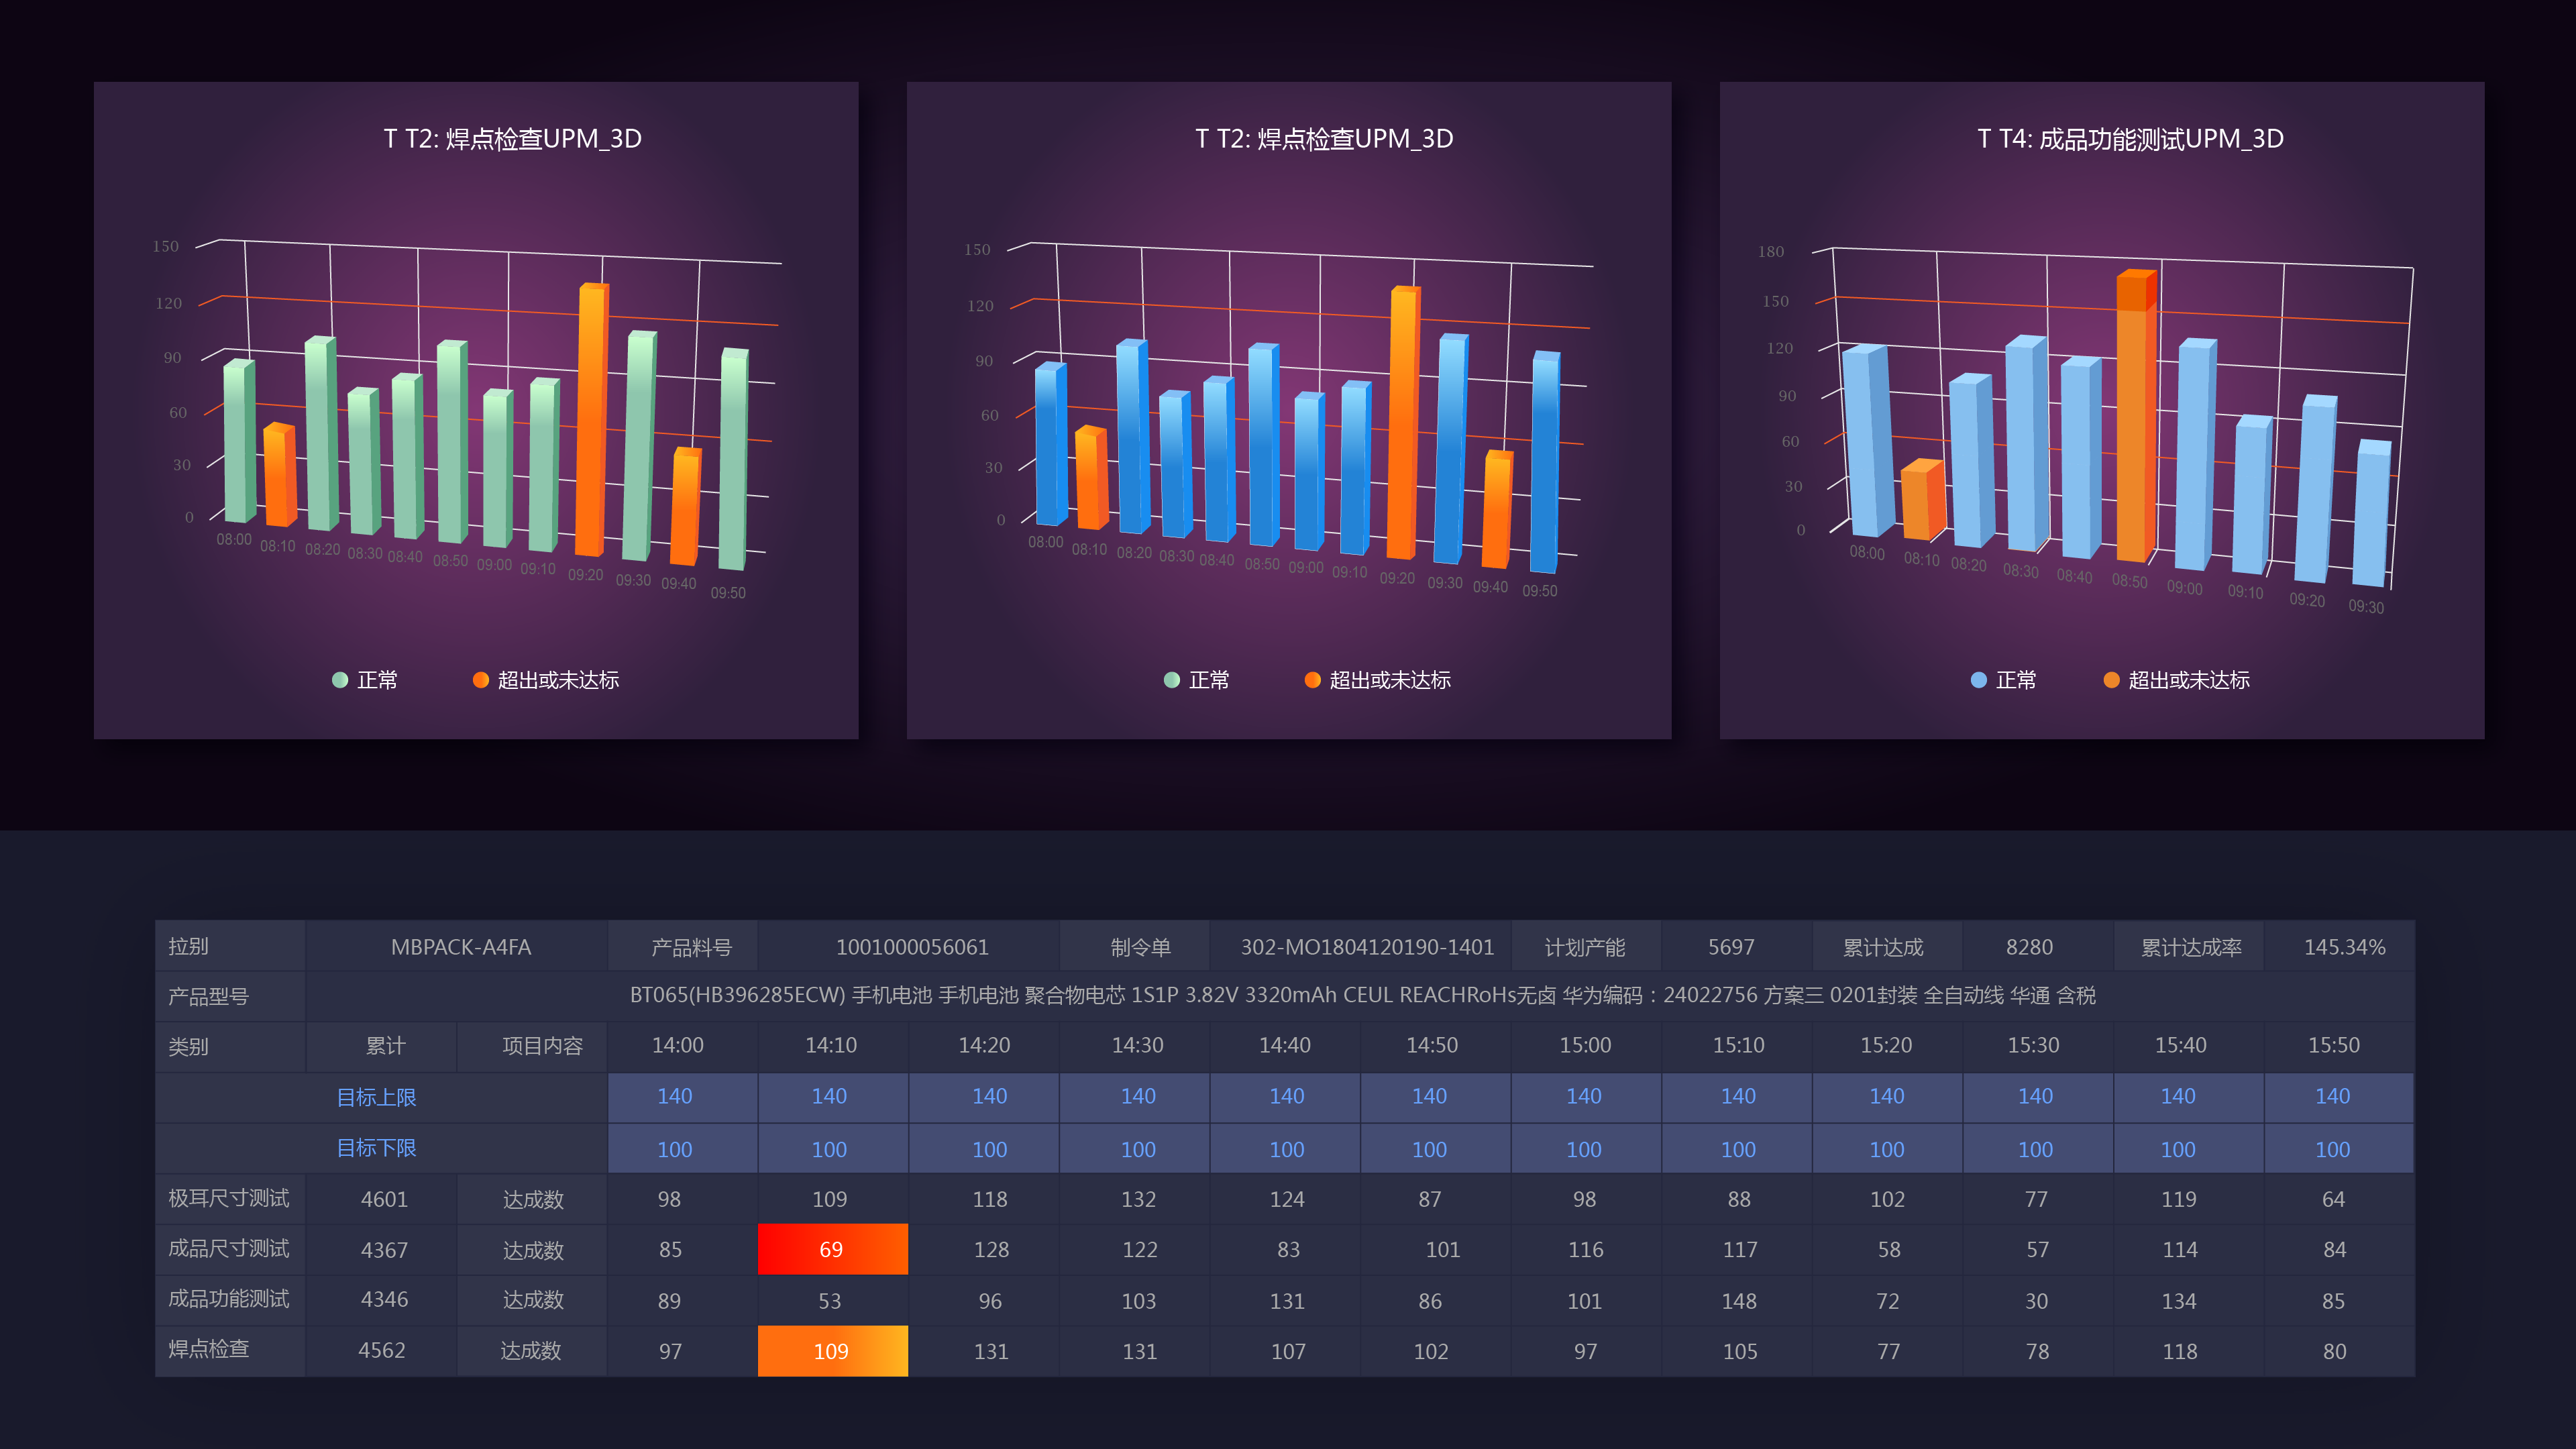
Dasudian Quality Analytics comprehensively and automatically shows quality metrics and information about your production processes:
Engineers, Plant Managers and Application Developers can define any metrics they want to track and get these insights by integrating IoT DataHub SDK at industrial fields and deploy algorithms on cloud. Engineers and Production Managers can get answers of these questions with quality analytics in real time:
Sign up now to see your quality analytics for free!
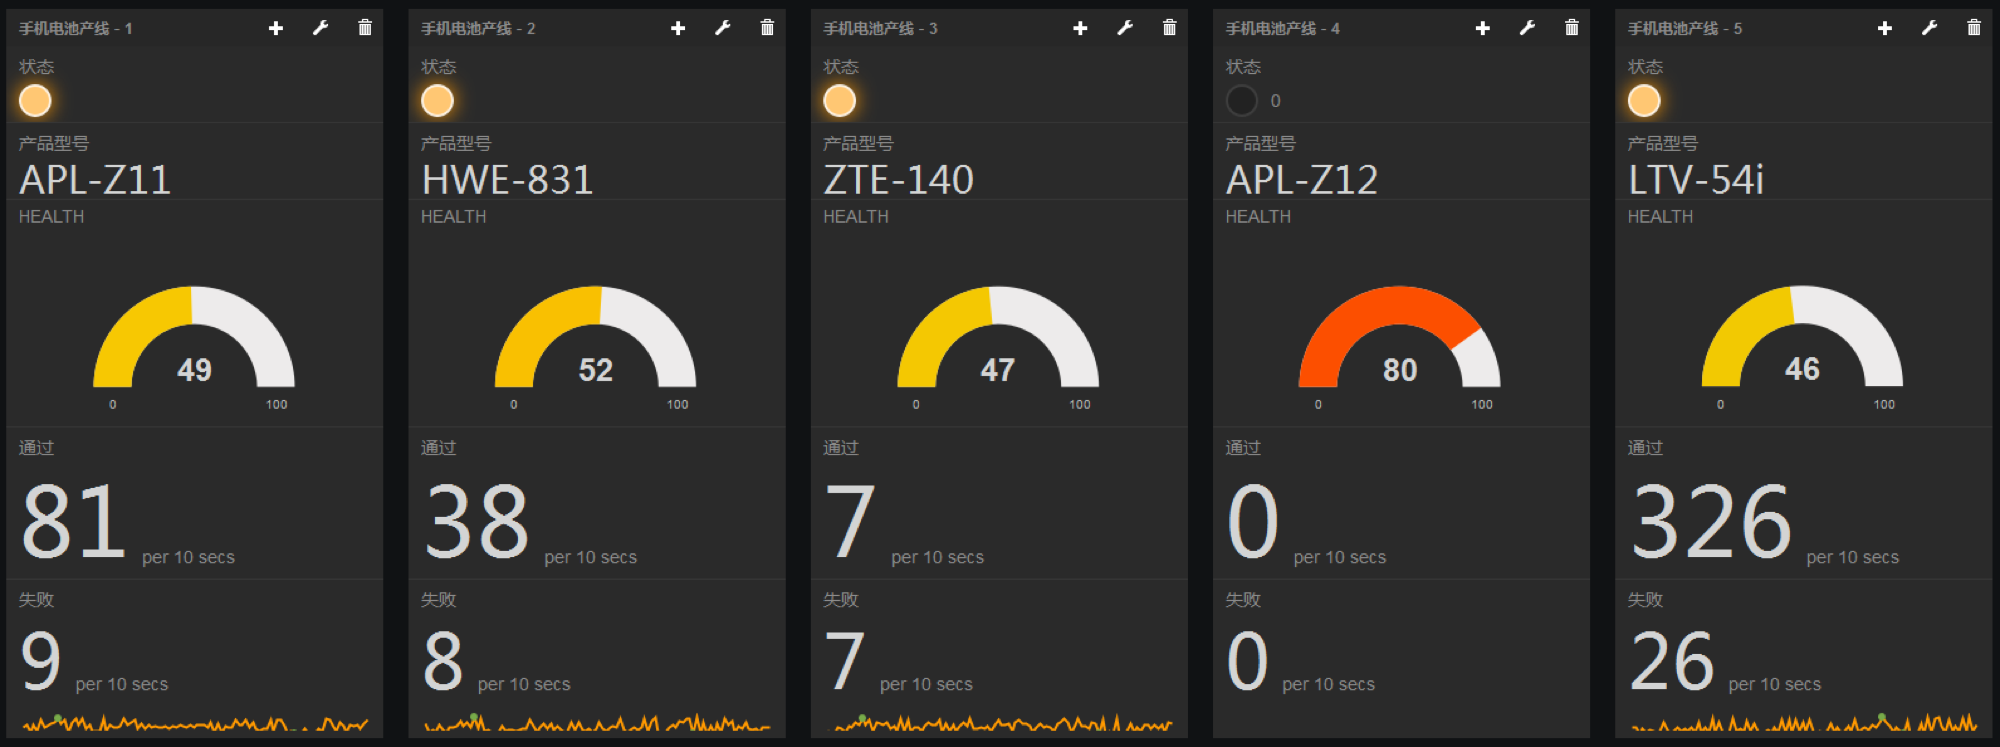
Dasudian Analytics allows Engineers and Production Managers to track event based insights as well. When you integrate our SDK, Dasudian Analytics automatically creates your events in your dashboard. You can track event-based actions or funnels in your dashboard.
Engineers and Production Managers can get answers of these questions with event-based analytics:
Sign up now to see your event-based analytics for free!.
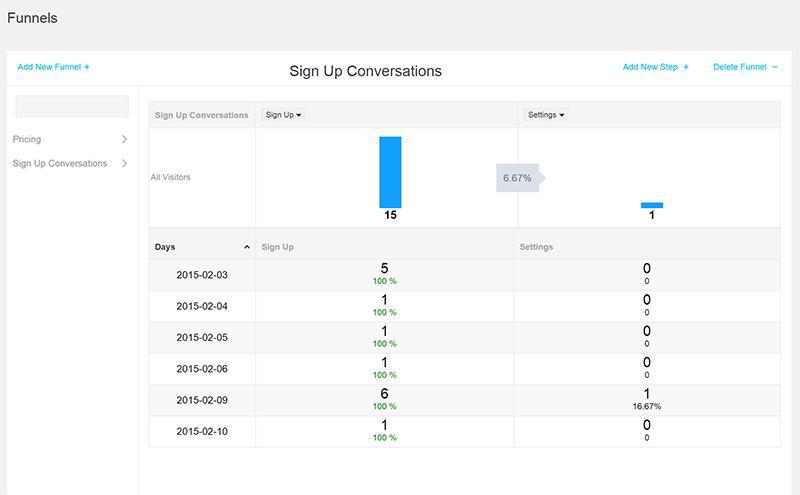
Dasudian Analytics allows you to create funnels by your events. It is easy to create funnels which has two or multiple steps in your dashboard. App developers can see most active funnels, funnel activity breakdowns and conversions minute-by-minute, hour-by-hour and day-by-day.
App Developers can get answers of these questions with conversion funnels:
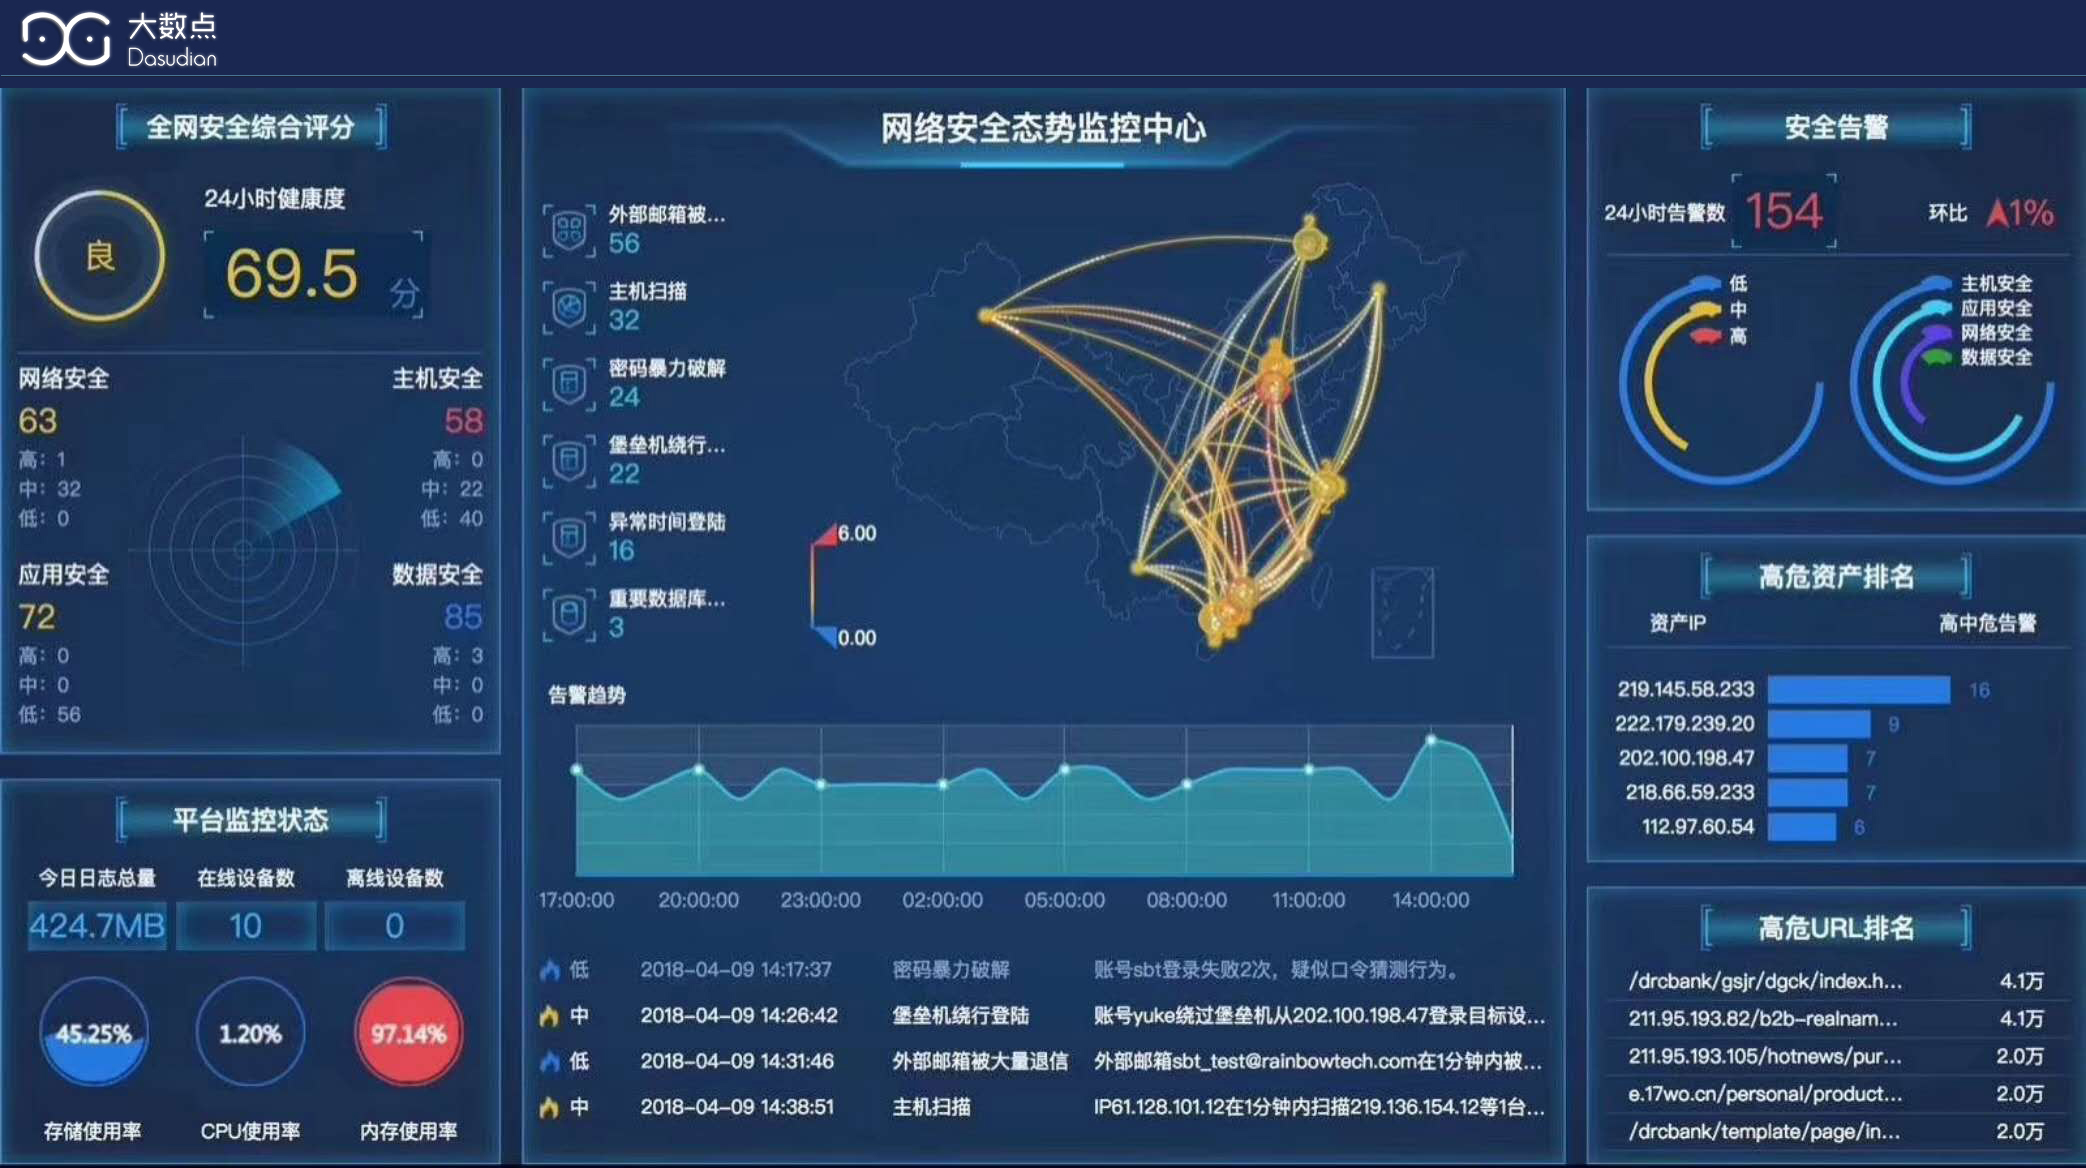
Dasudian Analytics allows you to get detailed information about your users's misoperations and attacks. You can find who your users really are which events they are performing. Also, you can track what kind of risks from where and performed by whom.
Engineers and Managers can get answers of these questions with user analytics:
Sign up now to see your risk analytics for free!
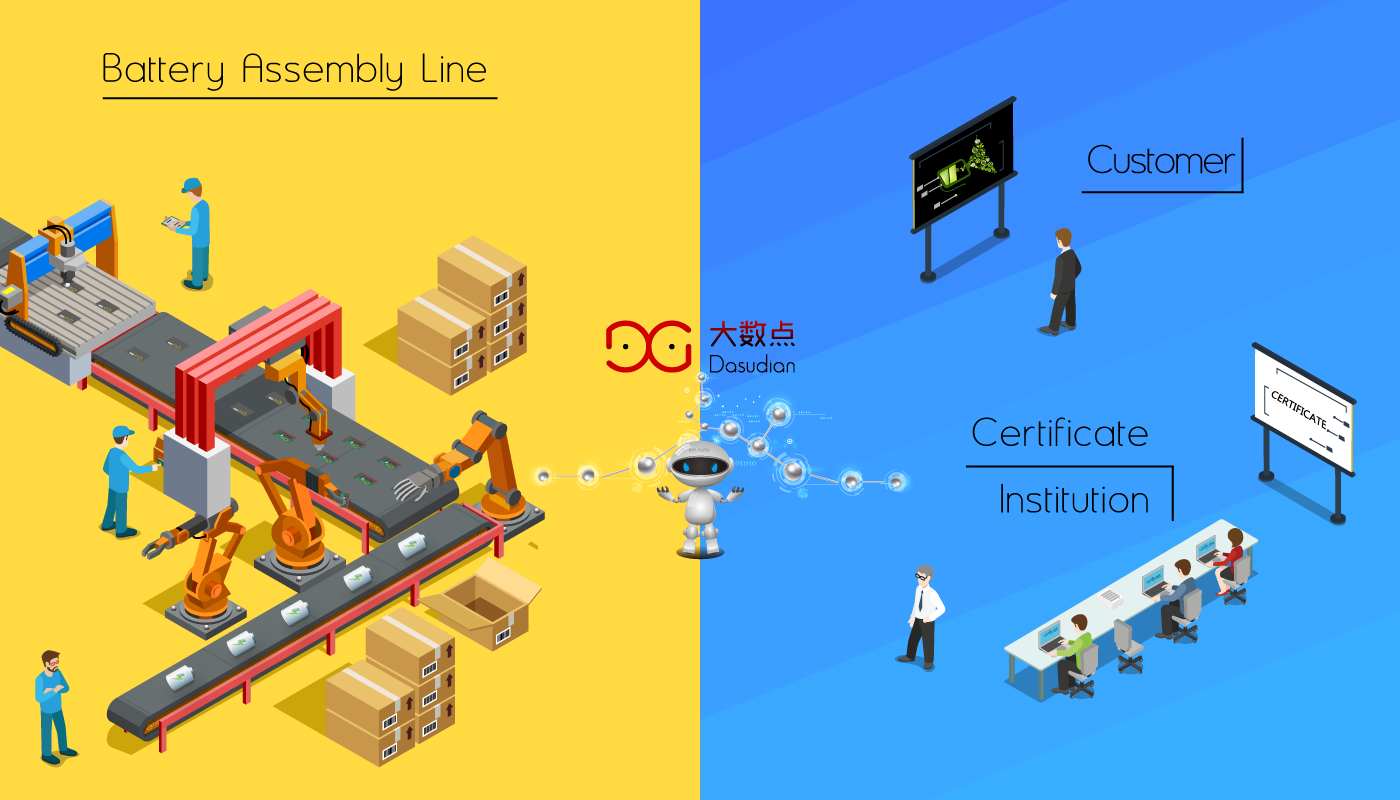
Dasudian Analytics processes data in real-time, analyzes your user interactions, assets status and operations for you and shows suggestions with respect to production and service optimization, sends instant controlling commands and recommendations. You can get optimization details in real-time smart notifications:
Engineers and managers can get answers of these questions with Smart Notifications:
Sign up now to see your free get your Smart Notifications!
Compatible with all platforms; Web, Linux, iOS, Android, Windows Mobile and Windows Desktop apps.
Dasudian’s SDK is lightweight & works in the background without impacting your app’s performance.
Integrate our analytics solution by adding the DataHub SDK and only a single line of code, in less than a minute.